- Assigned: December 1st (Tuesday)
- Due: December 15th (Tuesday)
Here's what you need to do:
- Get graph.tsv, which contains a file in which each line is a triple of the form: SOURCE_NODE <TAB> DESTINATION_NODE <TAB> WEIGHT. Note that source and destination nodes are integers, as are weights.
- Write one python function per item in the list below that uses
Spark to compute the desired information. Each function should
accept two arguments: a path to the graph.tsv file
and a path to an output directory. Use
Spark's saveAsTextFile() to save the final RDD to the
specified output directory. Note that, by default, if the target
output directory already exists when you attempt to save to it,
you'll get an error. One solution is to remove the target directory
between runs.
- For each node, compute the outdegree (number of outgoing edges) and output the (node, count) pairs in sorted order by node. The code should be in a single function named outdegree().
- For each node, compute the sum of weights of incoming edges and output the (node, weight_sum) pairs in order sorted by node. The code should be in a single function named weight().
- For each node X, find a list of all other nodes Y such that there is an (X, Y) edge in the graph and a (Y, X) edge in the graph, and output the (X, [Y1, Y2, ..., Yn]) pairs in order sorted by X. Hint: I solved this by building two RDDs, one in which edge source nodes are keys and destination nodes are values, and one in which edge destination nodes are keys and source nodes are values. The code should be in a single file named pairs().
Homework 6
- Assigned: November 10th (Tuesday)
- Due: November 24th (Tuesday) by 11:30am
- Install Hadoop. I suggest using the most recent version and installing binaries. You can do either a local install or a psuedo-distributed install. A local install will be easier to do and maintain.
- Read and work through the MapReduce tutorial for a working example of the word count problem. I would use that as a template and morph it into the code that you need to write.
- Write java code to perform k-means clustering using MapReduce.
The program must take 3 inputs in this order: k, full path to input
directory, full path to output directory. k is the number of
clusters.
- The values to be clustered are real numbers, and will be in a
single file in the input directory with one number per line and no
blank lines. For example, a file with 7 numbers to
cluster may look like this:
  0.1
  12.2
  3.4
  1.1
  0.78
  -14.2
  12.0
- Use the first k numbers in the input file as the initial centroids.
- It is perfectly OK for the mappers and reduces to open and read from files to load side information. For example, you will want to have a file somewhere that contains the cluster centroids at the start of each round.
- The mapper will read the centroids and then accept as input a key/value pair where the value is one of the numbers to be clustered. It will output the number and it's cluster index
- The reducers will use the cluster index as the key and therefore get a list of all numbers assigned to that cluster. The mean of those numbers is the new centroid.
- The values to be clustered are real numbers, and will be in a
single file in the input directory with one number per line and no
blank lines. For example, a file with 7 numbers to
cluster may look like this:
Turn in your code to the grader in a Slack message as a tar file. The main routine must be contained in a file named KMeans.java and all files must extract to the current working directory when you untar them.
Homework 5
- Assigned:October 29th (Thursday)
- Due: November 10th (Tuesday) by 11:30am
- 10.2 (k-means)
- 10.10 (BIRCH). Note that you'll have to read about the OPTICS algorithm in the text.
- 10.12 (density-based clustering)
- 10.18 (constraints and clustering) For this problem I'm just looking for you to propose some ideas. In addition to what's asked for in the book, say something about how your proposed modifications impact the computational complexity of the clustering algorithm.
Homework 4
- Assigned: October 20th (Tuesday)
- Due: October 29th (Thursday) by 11:30am to the TA via slack.
The MNIST dataset is a well-studied collection of handwritten digits. It is often used to test multi-class classification algorithms, where there is one class for each of the 10 digits (0 - 9).
I've made two files available for you:
- The raw MNIST data, which is a text file containing 10,000 rows. Each row contains 28 * 28 = 784 integers in the range 0 to 255. Each integer is the pixel value from a 28 x 28 image of a handwritten digit. Every row corresponds to a vector in the dataset that is to be clustered.
- The labels for the raw data are in a file with 10,000 rows. The first row contains the correct digit label for the first row in the raw data. The second row is the label for the second instance, and so on.
Implement 2-class logistic regression using gradient descent as outlined in the lecture notes. You can do either batch or stochastic versions of the algorithm. You will only use your algorithm for this dataset, so you can hard-wire in the number of instances and the size of each instance. The goal is not to write a generic version of the algorithm (though you can if you wish). The goal is to understand how it works on real data.
Use your algorithm to learn a classifier that determines whether an input image is an 8 or one of the other digits and record the classification accuracy on the training set (the full dataset I provided). Note that you'll have to come up with some stopping criterion, which could be to simply run for a fixed number of iterations and then quit.
After training is complete, create a 28x28 image of the learned weights. The largest weight (most positive) should map to black, the smallest weight (most negative) to white, and the other weights should linearly interpolate between those extremes.
One form of regularization (a way to prevent overfitting) is to encourage the weight vector to be sparse. That is commonly done in logistic regression by adding a term to the objective function that is the sum of the squares of the individual weights. We'd like to minimize that while maximizing the likelihood of the data.
Modify your code from above to include this term. Note that you'll have to consider the derivative of this term when computing gradients, and the formulation in class is maximizing likelihood whereas we want to minimize the sume of squared weights. Introduce a parameter, lambda, that is a constant used to multiply the sum of squares of weights. If lambda = 0, then you are running logistic regression without regularization. If you increase lambda, then you are putting more emphasis on small weights.
Generate a plot of training set accuracy as a function of lambda for several values of lambda. Briefly explain what is happening.
Submit the following in a Jupyter notebook:
- Your code
- The training set accuracy on the 8-vs-others classification problem
- The weight image along with a brief paragraph of what the image tells you about what was learned.
- The curve of training set accuracy as a function of lambda as described above, with an explanation.
Homework 3
- Assigned: September 29th (Tuesday)
- Due: October 13th (Tuesday) by 11:30am
In this homework you'll gain experience working with MongoDB and solidify your understanding of decision trees. Here are your tasks. Install MongoDB: Click here for directions.
Get the books data and insert it into a database:
- The books data in JSON format can be found here. Download the raw file.
- With mongod running, import the data into a database. This command worked for me: mongoimport books.json. That creates a database named test with a collection named books.
- Print just the titles of the first 5 books in sorted order by title. Use sort and limit.
- Print the title and author list of the first 5 books in sorted order by title that have exactly two authors. Use $size on the authors field.
- Print just the title of each book for which "W. Frank Ableson" is one of the authors. Use $all.
- Print just the titles in sorted order of every book with the word Web in the title. Use $regex.
- Print the number of distinct authors. Use distinct and len.
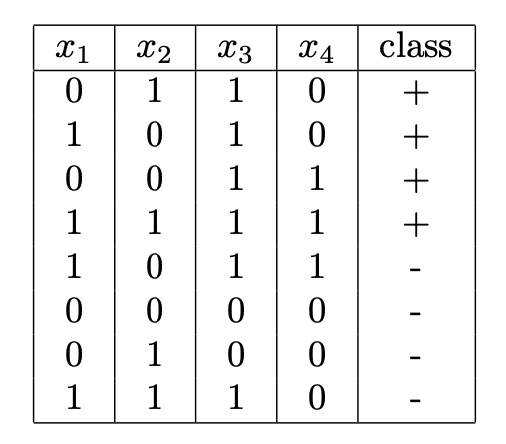
Use equation 3.4 from the Mitchell chapter on decision trees to compute information gain for each attribute to choose the root split for the tree. Give the computed information gain for each attribute and indicate which attribute should be used at the root of the tree.
Draw the full, unpruned tree that would be learned from this dataset. There is no need to do the full information gain computation for the splits below the root. Just "eyeball" the data and the correct splits should be obvious.
What to turn in: Turn in the notebook with the mongo queries with their output, and a written answer to the question on decision trees. That needs to be in a file that can be uploaded to slack. Turn both in to the TA via a slack direct message by the due date.
Homework 2
- Assigned: September 15th (Tuesday)
- Due: September 29th (Tuesday) by 11:30am
In this homework you'll gain experience installing and using SQL databases. Here are your tasks.
Install MySQL: Click here for directions.
Create a MySQL user for yourself:
- Run mysql --user root --password at the command line, enter the root password for MySQL that you created when installing MySQL, and run the following queries, replacing username and password as appropriate.
- CREATE USER 'username'@'localhost' IDENTIFIED BY 'password';
- GRANT ALL PRIVILEGES ON *.* TO 'username'@'localhost' WITH GRANT OPTION;
- QUIT;
- Then run mysql -p and enter the password you just specified.
- Try SHOW DATABASES; and you should see a few system DBs listed.
Install the Retailer sample database: Go here for instructions on getting the sample database. The result is a .zip file that, when extracted, gives you a .sql file named mysqlsampledatabase.sql, which is nothing more than a series of SQL commands/queries. To run it, do this: mysql -u username < mysqlsampledatabase.sql. As usual, you'll have to enter your password
To check that everything worked, do SHOW DATABASES in mysql and if you see one named classicmodels, then all is well. The web page that contains the link for the sample database has information on the tables and their fields.
Write each of the following queries: For each query, turn in the query and the result of running it on the Retail database that you just created.
- Count the number of employees whose last name or first name starts with the letter 'P'.
- For how many letters of the alphabet are there more than one employee whose last name starts with that letter? Hint: The substr function will be useful here in a GROUP BY clause.
- How many orders have not yet shipped?
- How many orders where shipped less than 2 days before they were required?
- For each distinct product line, what is the total dollar value of orders placed?
- For the first three customers in alphabetal order by name, what is the name of every product they have ordered?
Install the python connector for MySQL: In this part of the homework you'll get experience running queries from python code and write a simple program to extract the structure of a MySQL database.
- Go here to download the python connector.
- You can also 'pip install mysql-connector'.
- You can test the installation by running python and trying import mysql.connector. If that does not produce an error, you're good to go.
Your task is to write a python program that takes a single command line argument, which is the name of a database, and prints the names of all of the tables in that database along with the number of rows in each table. Read through the documentation on the python connector here to see how to create a connection, issue a query, and walk over the results. For this exercise you'll submit your python code, which should all be in one file, along with the output of running your program on the sample database you installed earlier. Hint: The SHOW TABLES query will be useful here.
Turn in two files, one with the queries and their output, and another with the Python program that prints out information on tables. Submit both files to the TA.
Homework
Homework 1
- Assigned: September 1st (Tuesday)
- Due: September 15th (Tuesday) by 11:30am
In this homework you'll gain experience exploring data with Jupyter notebooks and pandas. Jupyter auto-saves notebooks with some regularity, but I also tend to "Save and Checkpoint" periodically on the File menu because you can always revert to a checkpoint.
You will submit your homework as a notebook by uploading it as a file into the Slack channel for the grader (Shivani Birmal) by 11:30am the day the assignment is due. To do that, click on the + icon beside "Direct Messages" and start typing her name. As some point you'll see her name in a list of users below where you are typing. Click on her name. Once you're in a chat with Shivani, click the paperclip icon next to the space where you enter a message and choose the notebook you want to submit. The system will then allow you to add a message, which you should make "Homework 1 submission for NAME".
To add comments in your notebook, which you're asked to do to explain your thinking in a few places, you'll use markdown syntax in the cell. Look at the Basics tab on the main markdown page and it will tell you everything you need to know. Type your comments in a notebook cell and then either do "Cell" - "Cell Type" - "Markdown", or type CTRL-M M in the cell.
Choose any dataset you want. The dataset that I explored in class was from the Open Baltimore website. You cannot use that dataset. You can also use Google's dataset search to find a dataset. Choose one that allows you to perform the following tasks (you may have to look at a few of them):
- Load the data into a Jupyter notebook. Explain briefly (using markdown) what the dataset contains or what it is about. Do a head(50) and tail(50) on the data frame after loading the data. Explain any observations you can make about the dataset and its quality from just that output.
- Explore the data to understand what's in each of the columns.
If the dataset has a very large number of columns (more than 10) you
can choose a smaller subset of columns with which to work, but
justify why you selected those columns. For each of the columns,
but no more than 5 total columns:
- Describe what the column contains (e.g., the time at which a crime was committed, or the last sale price of a house) in prose
- Determine whether the column contains missing data, make a decision about how to handle them, and implement that decision
- Do the same for outliers or other unusual values. Determine if they exist and, if so, implement an approach to dealing with them
- Explain anything else interesting or unusual about the data in the column that you observed
- Create scatter plots of pairs of variables that you think might
be related, and for two such plots do the following:
- Explain why you think the two variables might be related
- Show the scatter plot
- Explain what the plot says, if anything, about the relationship between the variables. The explanation should be semantic. That is, don't say "x gets bigger when y gets bigger", say, for example, "it looks like crime increases later in the week, presumably because people are out later in the week and on the weekends".
- Pick one variable to be a dependent variable, and two others to be predictor variables. These choices should be based on your exploration above. Generate a 2-D or 3-D plot that shows whether the predictor variables actually convey information about the value of the dependent variable. That is, is it the case that knowing the value of the predictor variables gives you information about the dependent variable. Explain clearly why you think they do or do not by referring to the plot.