The Hailstone Sequence II 
For this homework, we'll be modifying homework 6 by adding another 
   option for the user to choose:
 
H - view a Histogram of chain lengths for a range 
 
Do NOT modify your original hw6.py file.  Instead make a copy 
   of your hw6.py file in your hw7 directory named hw7.py
 
The Task
We'll be using some of the methods from the graphics library to draw a
   histogram of chain lengths for a range of values.  This histogram will
   be drawn in a window.  How big should the window be ?  It depends on
   the user's input.
  Thoughts
 
   - How wide does the window have to be ?
 
   - We can't let the user choose a long range of numbers or else the
       window would have to be too wide or our bars too thin.  So let's always 
       have a range of 10 values and just let the user pick the starting value.
       
 
   - How will we know the highest bar in the histogram ?
 
   - Just like in the tic-tac-toe example from lecture, we'll create a 
       a window that is 500 x 500, let's title it "Histogram of Chain Lengths".
       Then we can use the setCoords method to have the coordinates match our
       data.
 
  
   - So what should the height of the y-axis be? The length of the
       longest chain plus some room for the labels at the bottom where
       n is shown.
 
   - How wide should the x-axis be? We want to show bars for 10 values and
       histograms look better if there is some space between the bars AND we'll
       need some space on the left for the lengths to be printed.  Let's try
       20.
 
 
The Modifications
First, the obvious modifications are : 
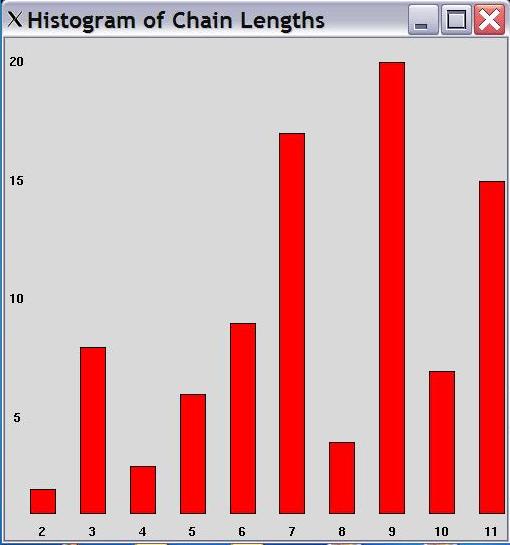
Now that you have everything set up, write the function drawHistogram()
 
Specifications for drawHistogram()
    - The title of the window should be: "Histogram of Chain Lengths".
 
    - The value of n should be printed beneath each of the histogram's bars.
        
 
    - Labels showing the lengths should be printed on the left side.
        See the sample histograms for what's expected.  Notice that the
        length labels along the left side change as the longest length of the
        chains change for different ranges.
 
    - The bars should be filled with a color different than the background
        color.
 
    - Since we want to allow the user to draw histograms for more than
        one range of numbers during the running of the program, we'll want
        to close the window after having enough time to view it.  You should 
        close the window after 10 seconds.  You'll need to use sleep() to
        do this.
 
    - All handling of the graphics window should be done within the
        drawHistogram() function.  In fact, since the window is opened in this
        function, it is local to this function.  Trying to close the window
        in main() will cause an error when run.
 
 
Sample Histograms 
Here's the histogram for the range 2 to 11 : 
 
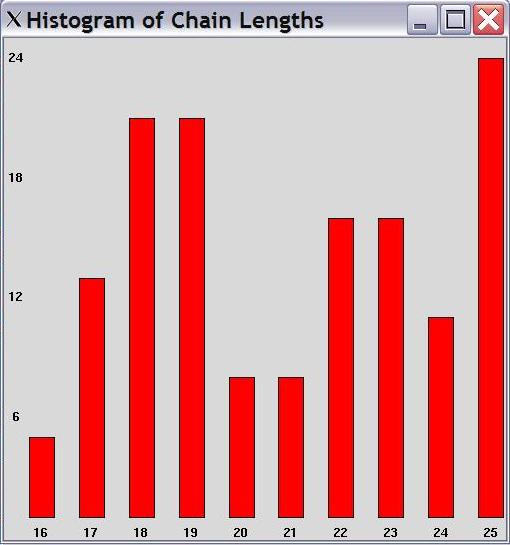
Here's the histogram for the range 16 to 25 : 
 
 
Submitting Your Work 
After you've finished your assignment, use the submit command to turn
   it in.
    - You must be logged into your account.
 
    - You must be in the same directory as the file you're trying to
            submit.
 
    - At the Linux prompt, type 
submit cs201 HW7 hw7.py
       
 
Don't forget to watch for the confirmation that submit worked correctly.
   Specifically, the confirmation will say: 
Submitting hw7.py...OK
   If not, try again. 
You can check your submission by entering
   submitls cs201 HW7
   You should see the name of the file that you just submitted,
   in this case, hw7.py.